DATA PROJECTS
A selection of projects in Data Engineering, Analytics, and BI.
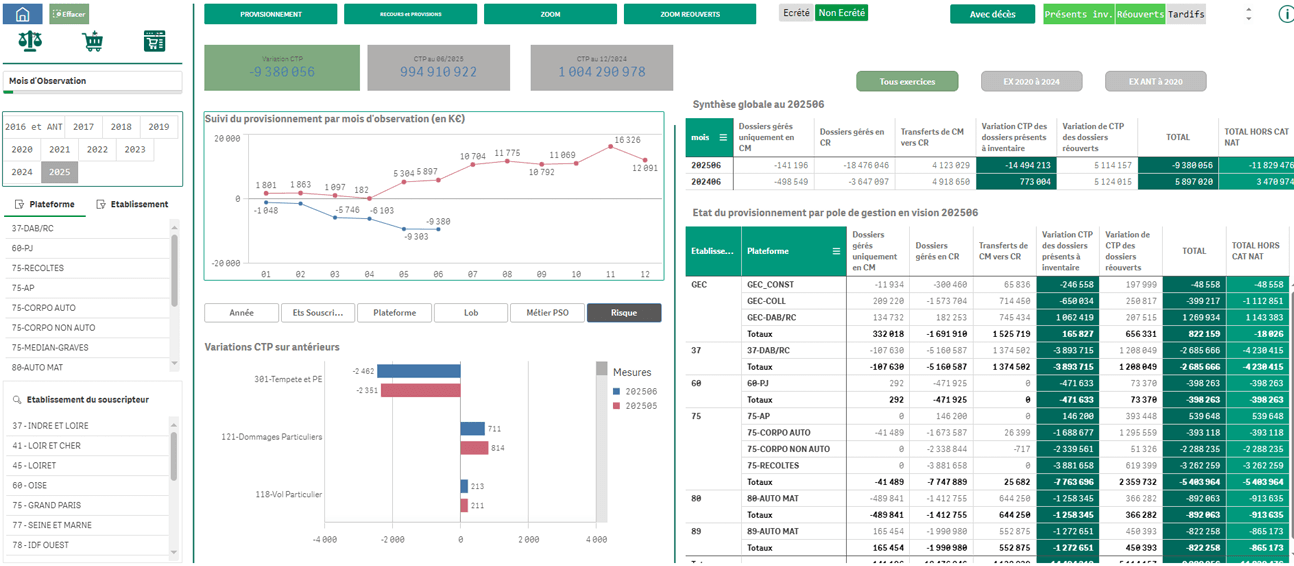
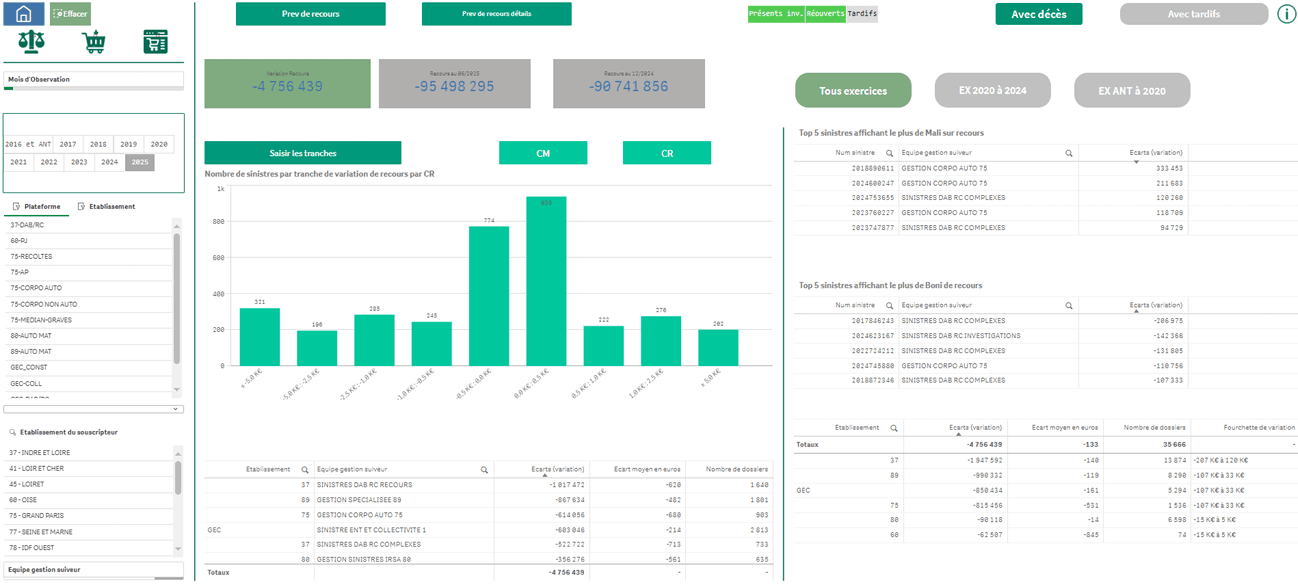
PROJECT 1 — Claims Steering (Qlik Sense / Oracle)
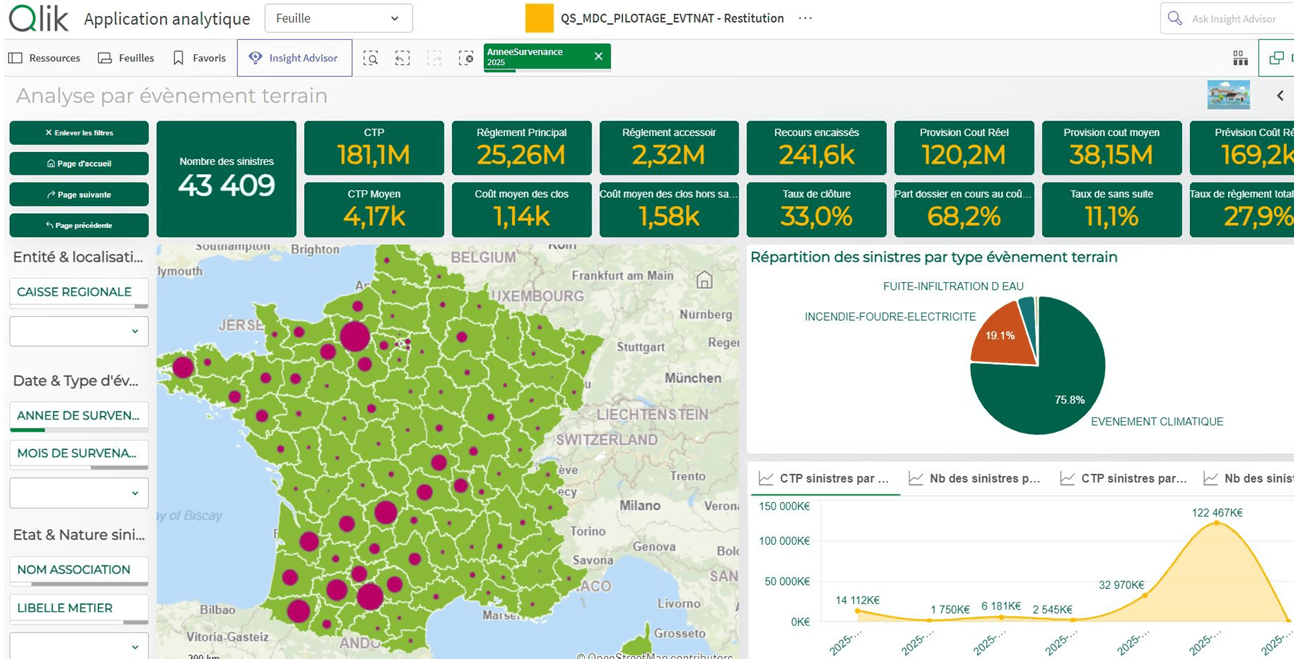
Context and Objective
Implementation of a centralized data foundation and Qlik Sense dashboards for technical steering and tracking of claims-related KPIs.
Missions:
- Construction of the data foundation under Oracle (structuring, format normalization, calculation rules)
- Development of Qlik Sense dashboards from the Oracle foundation
- Development of Qlik scripts: init load (full load) and delta (incremental loads), transformation, aggregation, etc.
- Reliability of indicators, harmonization of calculations, and improvement of dashboard readability for business teams.
PROJECT 2 — Passenger Flow Tracking (Aéroports de Paris)
Context
Project to implement a solution for predicting and tracking passenger flows for the operational steering of Paris airport zones
🔹 Architecture & Data Pipeline
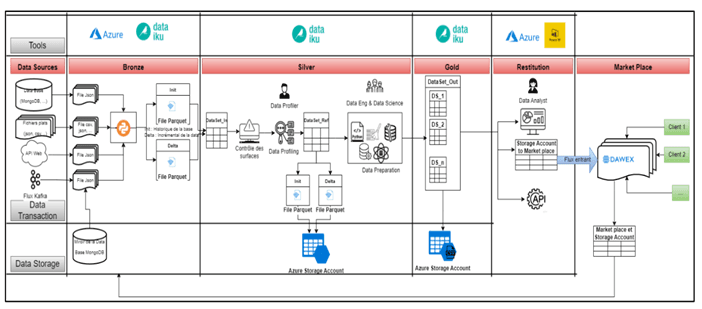
Participation in setting up a data pipeline for collection, streaming, storage, and transformation of multi-source data. Data is stored in the Bronze layer, converted to Parquet, then controlled via data profiling rules before feeding the Silver layer, and then prepared to feed the Gold layer with data for the prediction model, then the outputs are exploited in real-time visualization.
🔹 Ingestion & Streaming to BI
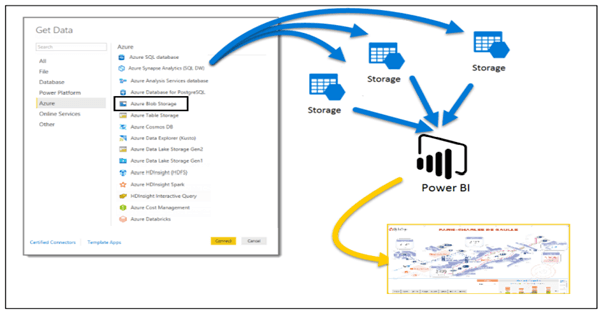
Participation in setting up a nearly real-time ingestion flow from Azure to Power BI for feeding operational dashboards.
🔹 Passenger Flow Steering Dashboard
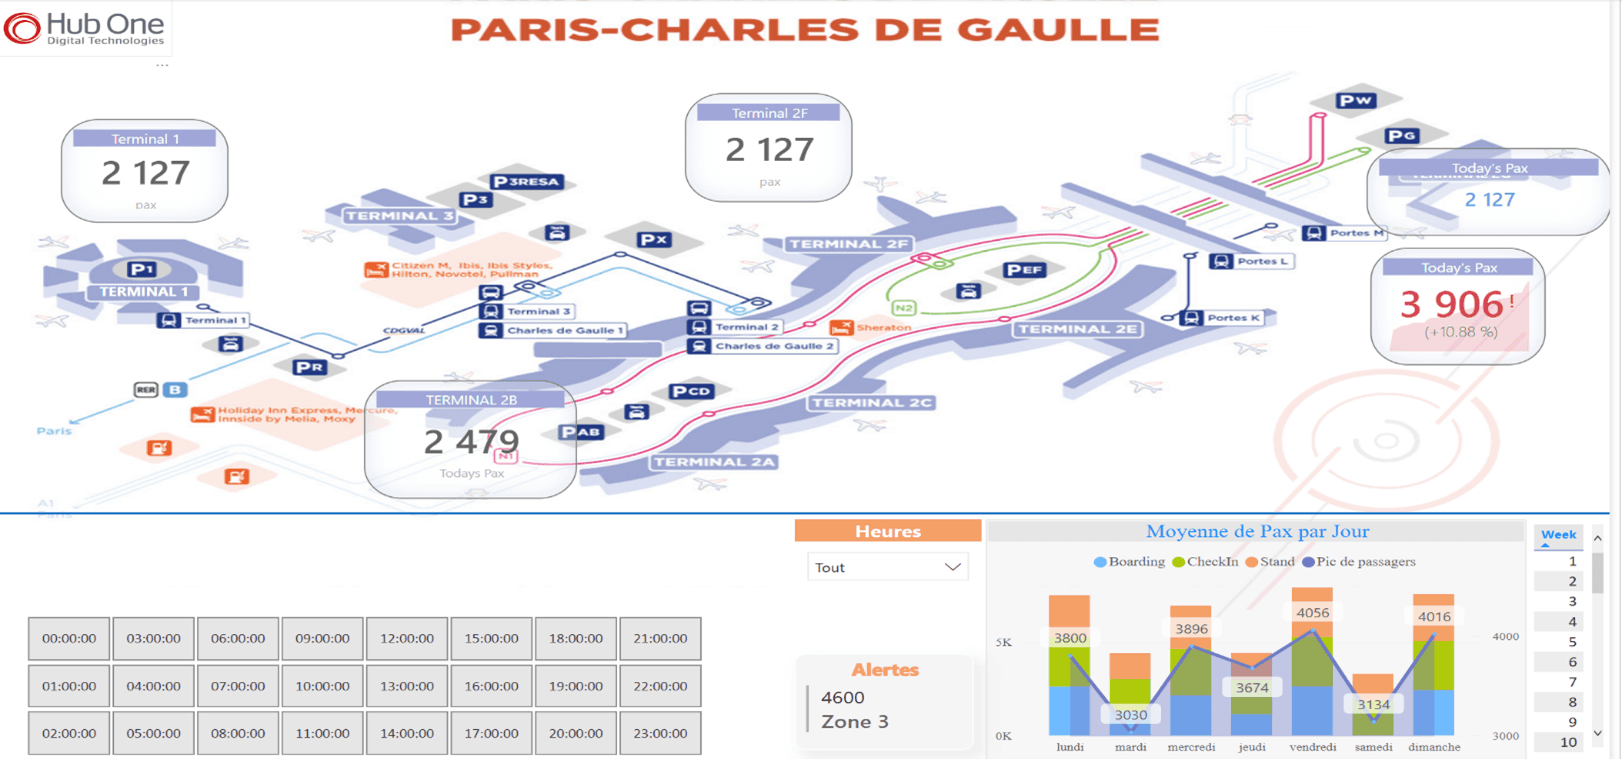
Design of an interactive dashboard representing airport zones, with tracking of passenger volumes by zone and period. Implementation of weekly average indicators and alerts for high-traffic zones.
PROJECT 4 — Internal Feedback Synthesis (Survey Analytics)
Context
BI and data analysis project for the synthesis of employee feedback from recurring internal surveys.
🔹 Analysis & Internal Survey Dashboard
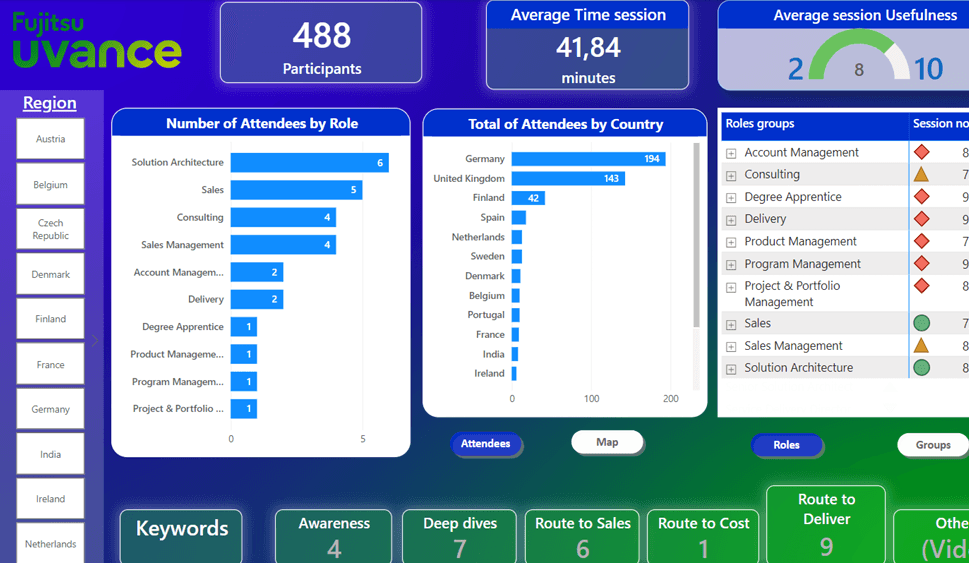
Implementation of an internal survey results analysis process. Extraction of recurring keywords from texts via Python scripts, data formatting, then consolidation of data into satisfaction, engagement, and participation indicators. Reporting is updated monthly via an automated scheduled process.